Omnichannel reporting stitches every customer touchpoint, phone, web, WhatsApp, email, in-store, into one deduplicated view of performance instead of siloed channel dashboards. For analysts, this means faster, reconciled decisions rather than reconciling five spreadsheets before a Monday meeting. Getting there depends on event standardisation and identity resolution, the same disciplines Wattle applies when merging call, chat, and SMS events into a single customer record.
TL;DR:
- Omnichannel reporting relies on event standardization and identity resolution to create a single, unified customer record that accurately reflects customer journeys across all channels.
- Accurate cross-channel attribution and deduplication significantly improve marketing ROI, customer lifetime value calculations, and reduce double-counted conversions.
- Building a reliable omnichannel dashboard requires layering multiple tools, including customer data platforms, data warehouses, and BI dashboards, with validation against settlement data.
- Implementing step-by-step processes such as data source inventory, event standardization, and identity matching ensures trustworthy reporting and mitigates common pitfalls.
- Conversation data from platforms like Wattle enhances omnichannel insights by automatically transforming chat, call, and message interactions into structured, reportable events.
Table of Contents
- What is omnichannel reporting, and how is it different from multichannel reporting?
- Why does omnichannel reporting matter for your bottom line?
- What KPIs and dashboard views should an omnichannel report include?
- Which tools and architectures power omnichannel reporting?
- How do you implement omnichannel reporting step by step?
- How do you choose between building and buying an omnichannel reporting solution?
- How does a conversation platform like Wattle feed omnichannel reporting?
- What business questions does omnichannel reporting actually answer?
- Common mistakes and quick wins from omnichannel rollouts
- See how Wattle turns conversations into reportable events
- Where to go deeper on omnichannel reporting
- Sources
What is omnichannel reporting, and how is it different from multichannel reporting?
Omnichannel reporting gives you one customer record that follows a person across every channel, from the first ad click to the phone call that closes the sale. It relies on identity resolution to match a website visitor to a phone caller to a WhatsApp contact, and on cross-channel attribution that credits the right mix of touchpoints instead of the last one to fire.
Multichannel reporting, by contrast, is what most businesses actually run today: separate dashboards for email, separate dashboards for paid social, separate call logs, none of them talking to each other. Twilio’s guide to omnichannel analytics frames this distinction plainly, noting that omnichannel analytics requires consolidating data across every channel rather than analysing each in isolation. The practical difference shows up fast once you dig in.
- Single customer view: one record per person, not one record per channel per person.
- Identity resolution: matching a phone number, email, and device ID to the same human, deterministically where possible, probabilistically where not.
- Cross-channel attribution: crediting a sale to the channels that actually contributed, not just the last click.
- No duplicate counting: a customer who calls after clicking an ad appears once, not twice.
Picture a customer who sees a Facebook ad, browses your site, then calls to book. Multichannel reporting shows that as three unconnected events across three dashboards. Omnichannel reporting shows it as one journey, one customer, one attributed outcome.
Why does omnichannel reporting matter for your bottom line?
Unified reporting cuts the hours analysts lose reconciling conflicting numbers from ad platforms, CRMs, and call logs. When every channel reports its own version of “conversions,” attribution variance creeps in, and teams end up trusting whichever number looks best rather than the one that is actually correct. A reconciled, order-level view removes that variance before multi-touch attribution numbers are trusted, according to analysis on why platform-reported revenue conflicts.
The outcomes compound once the data is trustworthy:
- Clearer customer acquisition cost (CAC) because spend and conversions map to the same deduplicated customer, not five inflated per-channel totals.
- More accurate customer lifetime value (CLV) since purchases across channels roll up to one profile instead of fragmenting across systems.
- Fewer double-counted conversions, which stops budget getting allocated to channels that only look effective because they are stealing credit from others.
Gartner has forecast that roughly 80% of B2B sales interactions will happen through digital channels by 2025, a shift that makes fragmented reporting increasingly indefensible. Marketing gets cleaner channel ROI. Sales gets a full contact history instead of guessing what a lead has already seen. Support gets context on every prior interaction. Finance gets numbers that tie back to what actually settled in the bank account.
What KPIs and dashboard views should an omnichannel report include?
Start with metrics that only make sense once channels are unified, not ones you could already get from a single platform’s native dashboard.
- Deduplicated revenue: total revenue after removing duplicate customer records across channels.
- CLV: lifetime value calculated on the merged customer profile, not per-channel purchase history.
- CAC by channel: acquisition cost attributed fairly once cross-channel touchpoints are accounted for.
- Conversion paths: the sequence of touchpoints, ad, email, call, that precedes a sale.
- Attribution window comparisons: how results shift when you measure by conversion time versus interaction time, a distinction Google Analytics’ cross-channel reporting lets you configure directly.
- Engagement rate by channel: response and open rates for email, SMS, and chat side by side.
Real-time tiles suit operational monitoring, live call volume, chat queue length, today’s bookings, where a five-minute delay costs you a customer. Batched summaries suit anything that needs validation against settlement data before anyone acts on it, like monthly revenue attribution or CAC trends. Klaviyo’s omnichannel reporting leans on real-time message-level updates precisely because campaign performance across email, SMS, and push needs to be visible while a campaign is still running, not the next morning.
A workable dashboard layout usually has four views: an overview tile for daily health checks, a channel comparison view for budget conversations, a journey trace for understanding how specific customers convert, and an anomaly view that flags sudden drops or spikes before they become a Monday-morning fire drill.
Pro Tip: Build the anomaly view first, even before the executive overview. Catching a tracking break on day two saves you from presenting a quarter of bad numbers to leadership.
Which tools and architectures power omnichannel reporting?
No single tool does this end to end. Most working setups stack four or five layers, each solving a different problem.
- Customer Data Platform (CDP): collects and unifies identity across channels, the foundation for the single customer view.
- ETL/ELT pipeline: moves raw events from source systems into a central store, standardising formats along the way.
- Data warehouse: holds the reconciled, deduplicated version of every event, the source of truth everything else reads from.
- BI/dashboard layer: the visualisation tool analysts and executives actually look at, whether that is a native platform report or a purpose-built dashboard.
- AI/reasoning layers: increasingly used to surface anomalies, summarise trends, or answer ad hoc questions against the warehouse without writing SQL.
A common architecture pattern lands raw events into the warehouse through an ELT pipeline, deduplicates them against transaction IDs in a reconciliation layer, then exposes consistent KPIs through a semantic layer that every downstream BI tool reads from consistently, an approach detailed in ecommerce omnichannel analytics guidance.
Native platform dashboards, the ones baked into your ad platform or CRM, are fast to set up but only ever show their own slice of the truth. A unified analytics layer takes longer to build but is the only way to see the full customer journey. Microsoft’s real-time omnichannel dashboards illustrate the middle ground: role-based filters and live KPI monitoring built specifically for service teams who need speed without sacrificing structure entirely.
Privacy considerations sit underneath all of this. Server-side tracking reduces reliance on browser cookies that regulators and browsers are steadily restricting. Consent handling has to be baked into the pipeline from day one, not bolted on afterwards. First-party data enrichment, using your own CRM or call records to fill gaps, matters more every year as third-party identifiers degrade.
How do you implement omnichannel reporting step by step?
Building this properly is a sequence, not a single sprint. Skipping steps is how teams end up with dashboards nobody trusts.
- Inventory your data sources. List every system that generates a customer event: ad platforms, website analytics, phone systems, chat, email, POS. Define exactly which events matter (a booking, a call outcome, a payment) before building anything.
- Standardise events. Agree on naming conventions, timestamp formats, and user identifiers across every source. A “purchase” event from your ecommerce platform and a “conversion” event from your ad platform need to mean the same thing once they land in the warehouse.
- Build identity resolution and a single customer view. Match phone numbers, emails, and device IDs to one profile. Deterministic matching against known identifiers, backed by probabilistic fallback where deterministic data is missing, tends to give the best trade-off for most organisations, per Twilio’s implementation guidance.
- Choose and document your attribution model and deduplication rules. Decide upfront whether you are crediting first touch, last touch, or a multi-touch blend, and write down the rule so nobody re-litigates it every quarter.
- Build dashboards and automate refresh cadence. Real-time for operational tiles, batched for anything financial. Automate the refresh so nobody is manually pulling exports on a Friday afternoon.
- Validate against settlement data. Before trusting any platform-reported revenue number, reconcile it against what actually settled in your payment processor or bank feed.
- Run incrementality or holdout tests. Once the basics are reconciled, test whether a channel is actually driving incremental revenue or just claiming credit for sales that would have happened anyway.
Most teams get steps one through four right and then skip step six entirely, which is exactly why finance stops trusting marketing’s numbers by quarter two.
How do you choose between building and buying an omnichannel reporting solution?
Start with an honest read of your own readiness. Do you have engineering capacity to maintain a pipeline, or would that capacity be better spent elsewhere? Do you have two or three genuinely business-critical use cases, or a wish list of forty metrics nobody will look at weekly? Do you need sub-minute latency, or is next-morning batching genuinely fine for your decisions?
If you are evaluating a vendor rather than building in-house, run through this checklist:
- Connector breadth: does it natively pull from your phone system, website, WhatsApp, and payment processor, or will you be stitching custom integrations regardless?
- Identity resolution detail: ask exactly how they match a caller to a web visitor. Vague answers here are a warning sign.
- Attribution flexibility: can you configure attribution windows and models, or are you locked into their default?
- Latency: what is real-time and what is batched, and does that split match your actual decision-making cadence?
- Security and compliance: encryption at rest, audit logging, and role-based access should be standard, not a premium add-on.
- Exportability: can you get your own data out in a usable format, or does the vendor become a permanent dependency?
Pro Tip: Ask any vendor to walk you through a reconciliation discrepancy from last month, live. If they can’t explain a gap between their dashboard and your bank statement, that gap will happen again.
Red flags worth walking away from: opaque attribution logic nobody can explain, weak reconciliation against settlement data, and contract terms that make your own data hard to extract later.
How does a conversation platform like Wattle feed omnichannel reporting?
A voice and messaging platform generates exactly the kind of structured event data omnichannel reporting depends on. Wattle answers calls, web chats, WhatsApp messages, and SMS, and every interaction produces a record: a booking confirmation, a call outcome, a payment status, a captured contact detail.
Those events map directly onto the KPIs discussed above. A completed call outcome feeds conversion path data. A Stripe payment status feeds deduplicated revenue. A missed-call text follow-up feeds engagement rate by channel.
- Cross-channel events: calls, SMS, web chat, and WhatsApp conversations grouped into one customer thread, not five disconnected logs.
- Governance signals: encrypted credentials, audit events on sensitive actions, and short-lived signed URLs for private recordings.
- Integration paths: calendar sync, Stripe payment status, CSV export, and workflow triggers through Zapier or n8n for teams building their own warehouse pipeline.
What business questions does omnichannel reporting actually answer?
The real test of any reporting setup is whether it answers the questions someone in your Monday meeting is actually asking. “Which channel drove this sale?” is unanswerable from a single-platform dashboard when the customer touched three channels before converting. Omnichannel reporting answers it directly, because the customer record already carries the full path.

It also answers questions nobody thinks to ask until the data is unified: which channels overlap in reach and quietly cannibalise each other’s reported conversions, and where a channel that looks weak in isolation is actually driving a halo effect that shows up as a lift in a different channel entirely. Research on cross-channel measurement models points to this halo effect as one of the biggest blind spots in channel-level analytics, where a channel gets zero credit for demand it quietly created elsewhere.
For sales teams, it answers “has this lead engaged with us before, and how?” without anyone digging through three systems. For finance, it answers “does marketing’s reported revenue match what actually settled?” For customer support, it answers “what has this customer already tried, and where did it break down?” Every one of those questions was previously answered with a guess, a Slack message, or an outdated spreadsheet. Omnichannel reporting replaces the guess with a record.
Common mistakes and quick wins from omnichannel rollouts
Most teams overreach first: they try to report on every KPI simultaneously and end up with a dashboard nobody opens. Pick two or three metrics that actually change a decision, deduplicated revenue and CAC by channel, for instance, and prove the model works before expanding. Validate platform-reported conversions against settlement data early, not after leadership starts quoting the numbers. And build identity resolution as a lightweight, iterative process rather than a six-month big-bang project.
— Christopher
See how Wattle turns conversations into reportable events
Every call, chat, and WhatsApp message your business handles is a data point sitting outside your reporting stack, until it isn’t. Wattle answers those conversations with AI voice agents, then turns each one into a structured event: a booking, a call outcome, a payment status, a captured detail, all flowing into one unified inbox instead of scattered across call logs and sticky notes.
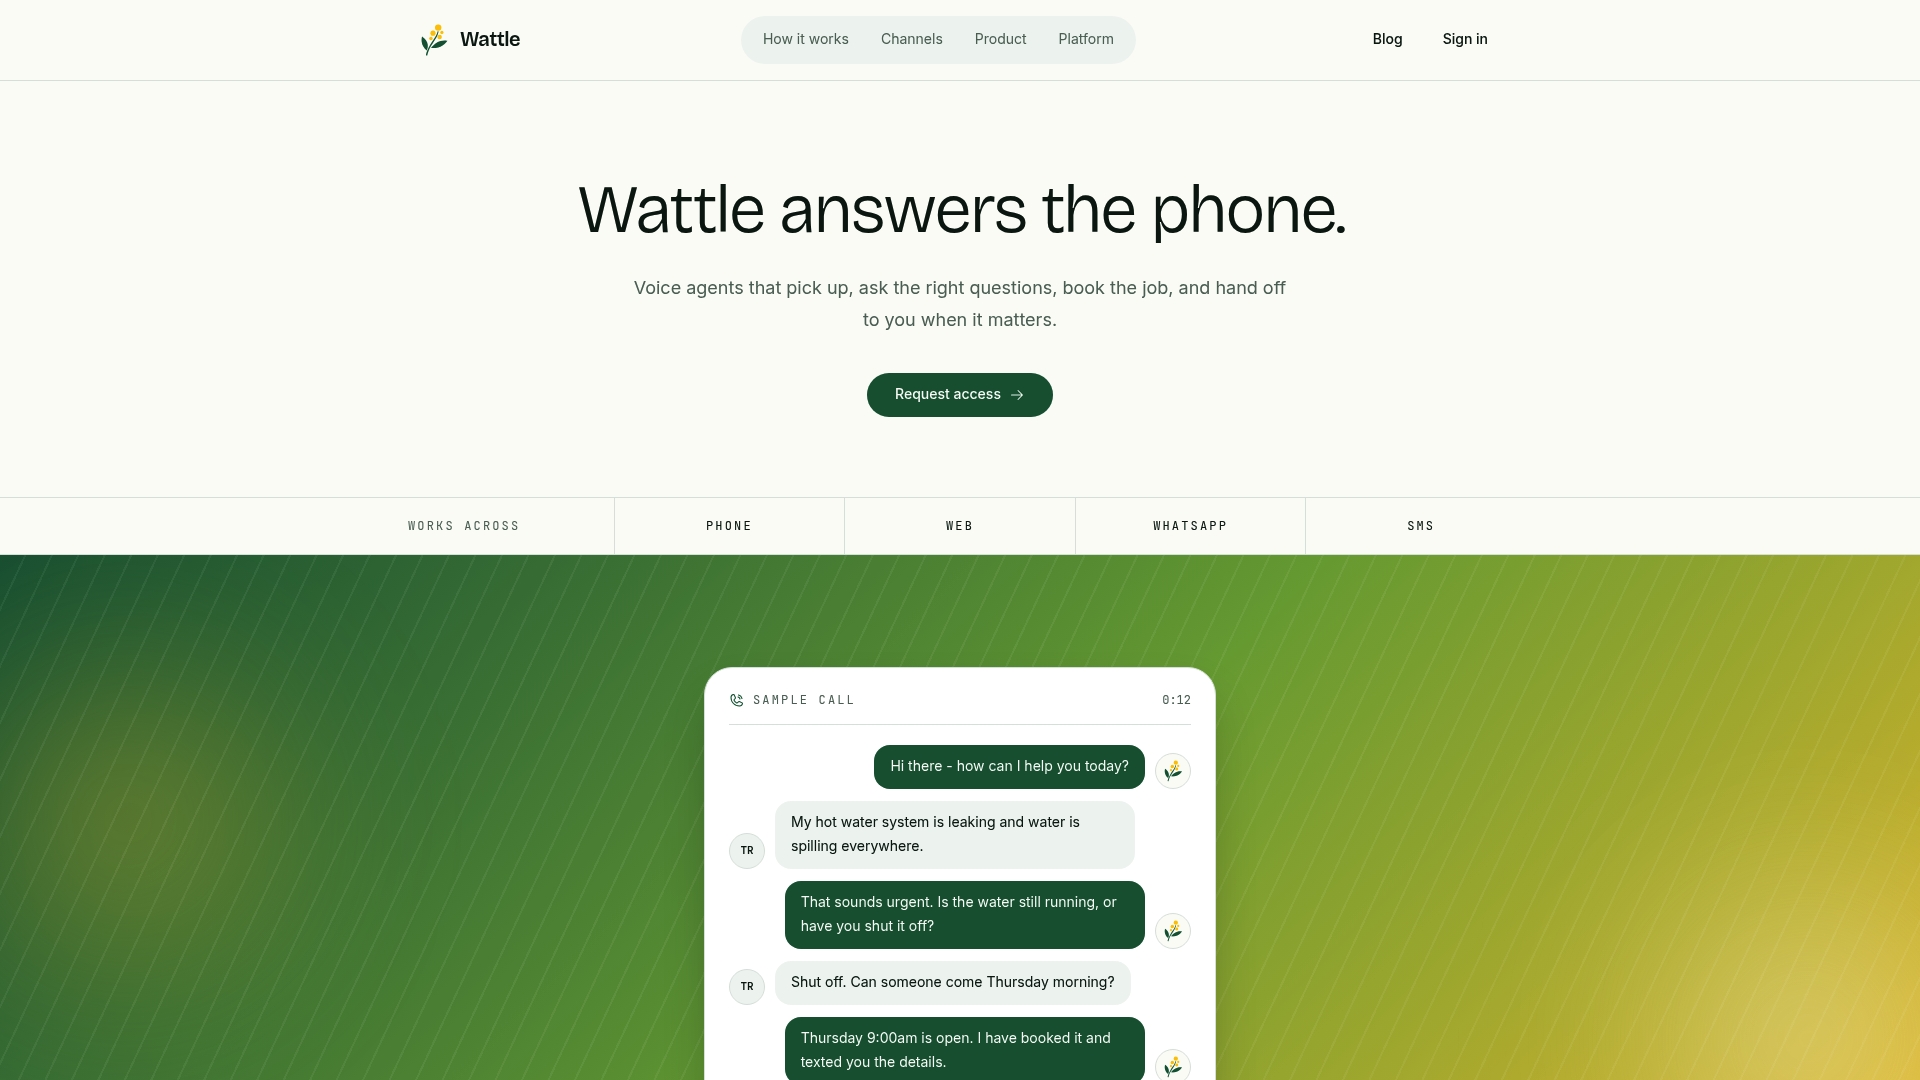
That matters for omnichannel reporting because conversation data is usually the messiest channel to unify. Wattle handles phone, web chat, WhatsApp, and SMS under one contact record from the start, with encrypted credentials, audit logging on sensitive actions, and CSV export for teams feeding their own warehouse. Calendar sync and Stripe payment status flow through automatically, so a booking and its payment outcome are already reconciled events rather than two numbers you have to match manually later. If your reporting stack is missing reliable conversation data, see how Wattle’s platform works and book a demo to see the event structure firsthand.
Where to go deeper on omnichannel reporting
For hands-on documentation, Microsoft’s guide to real-time omnichannel dashboards covers dashboard filters and security roles in detail. Twilio’s omnichannel analytics resource walks through implementation steps end to end. Google’s cross-channel conversion reporting documentation explains attribution window configuration, and Whatagraph’s step-by-step guide offers a practical KPI selection framework for teams starting from scratch.
Sources
- Overview of Omnichannel real-time analytics dashboard
- A Guide to Omnichannel Analytics & Reporting
- Omnichannel reporting (Klaviyo)
- Cross-channel conversion reporting in Analytics
- Gartner prediction on digital B2B interactions
- Ecommerce omnichannel analytics: why data from multiple platforms conflicts